To measure hydroxyl and acid numbers online in resin melts to determine end of reaction across different products with a ClearView db photometer and fiber optic probe.
NIR spectra were taken at 245 °C in a 1 cm cuvette using a NIR-O spectrometer. The data was analyzed with the chemometric method of partial least-squares (PLS). This guides wavelength selection for the ClearView db photometer. Multiple linear regression (MLR) is then used for calibration. It is possible to select enough wavelengths to obtain a reasonable fit with MLR. However if, the PLS will not converge, then it is likely the MLR model is over fitted. The ClearView db photometer is configured with the selected wavelengths, the samples are run and the MLR model is calibrated for online use.
Using a Photometer to Measure Hydroxyl and Acid Numbers in Resin Melts
Lab Reference Values and Sample Spectral Data from two different polymer manufacturers were analyzed. Each set of samples spans several types of resin melt products. The products in the first set (the simplest case) have a similar spectrum and require fewer wavelengths to calibrate than the second set. The following describes our systematic approach to these different sample sets.
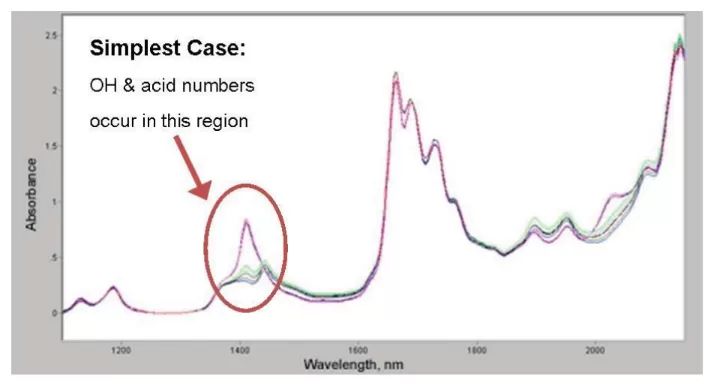
Figure 1 A very simple data set. Because the various polymer products are of similar chemistry the analysis of the spectral data can be achieved with a photometer.

Figure 2 A more common or general sample set. The various polymer products have different chemistries and therefore the spectral variation is higher. When the spectral variance is high a full spectrum NIR Process Spectrometer is required to monitor the resin melt.
The resulting spectra (Figure 1 and Figure 2) are shown at right for several different resin products. C-H overtones are present in the 1700 and 1200 nm regions. There is little difference in the C-H regions among these similar samples. Hydroxyl has a strong peak at about 1410 and a weaker peak at 2020 nm. Samples with high hydroxyl number have low acid numbers, and vice versa.

Figure 3 Partial least Squares analysis of the “Simple Data Set”.

Figure 4 Partial least Squares analysis of the “General/Common Data Set”.
This set of samples shows the strong effect of hydroxyl variations in the 1400 and 2000 nm regions, similar to that presented above. However, the
C-H regions near 1200 and 1700 nm exhibit more structure here. In particular, different product types show stronger differences near 1150 nm, a region that indicates a more unsaturated character.
PLS Analysis Of the General Case

Table 1

Figure 5 Results from Partial Least Squares Regression
As before, the PLS analysis of these samples at 245 C indicates that only one wavelength is required for hydroxyl number, shown in Figure 4 (top row of graphs). Acid Number (lower row of graphs) converges in 3 PLS factors, rather than 2, as in the simpler case. As before, the beta coefficient plot shows the negative contribution from hydroxyl near 1412 nm and positive contribution near 1440 nm. However, this plot also shows a strong positive contribution near 1150 nm and a weaker negative contribution near 1620 nm. These reflect the additional complexity across product types in this sample set. The resulting laboratory regressions for this data set resulted in SEE (standard error of estimate) values for hydroxyl and acid number of 1.3 and 0.4, respectively.
Progression to Online NIR Measurements
Samples are then re-run in a ClearView db. Absorbances are exported into a Microsoft® ExcelTM spreadsheet and the regression coefficients determined. The ClearView db is shipped with this “preliminary” factory calibration. It can be tested it online for a few weeks and, if necessary, the model may be improved by recording the absorbances from the ClearView db, determining the hydroxyl and acid numbers on grab samples taken to the laboratory, and computing new regression coefficients. The result of this online upgrade process is shown above for hydroxyl number for this data set using a ClearView db connected to a fiber optic transmission probe inserted directly into the reactor at 245 °C. The resulting SEE was 1.9, or about 2% full scale.
Different NIR Calibrations Among Products
Although it was found that the same calibrations could be used among the different products in both sample sets described above for each parameter, this may not always be the case. The powerful microprocessor in our ClearView db photometer can be programmed to use a different calibration based upon the different spectral characteristics in the 1100 – 1200 nm C-H region, for example.
Conclusion – Acid value and hydroxyl number are required for the determination of end-of-reaction
These data indicate that when only acid value and hydroxyl number are required for the determination of end-of-reaction, a ClearView db filter photometer is all that is required for one or two sample points. In fact, ppm water and yellow color can also be added and measured simultaneously. If your chemistry changes over time, or you need to predict several other properties, such as cross-linking, etc., it may be better to select a spectrophotometer, such as a Guided Wave NIR-O NIR Process Analyzer Spectrometer.
In summary, for single or dual-point measurements in systems, our low-cost ClearView db photometer can provide simultaneous measurements of both parameters. For more complex chemistry choose a NIR-O Process Analyzer Spectrometer. The NIR-O Process Analyzer Spectrometer is also capable of automated outlier detection. A variety of fiber optic probes are available, from insertion probes that can withstand up to 300 °C with temperature cycling, or flow probes for transfer pipes.
Need a Feasibility Test of YOUR Resin Melt Samples?
Guided Wave can perform a feasibility study with your samples to assist you in determining the most cost-effective solution for your application. In many cases, you may already have spectral data taken with other spectrometers in your company. We can import these spectra into our multivariate analysis software, perform the above calculations and provide the necessary guidance.

Support: info@process-insights.com
TERMS AND CONDITIONS
TERMS AND CONDITIONS FOR SERVICE
SELLERS AGREEMENT
DATA PROTECTION
FRAUD ALERT
CHINESE