On-Line Monitoring of Ethylene: Diethylene Glycols with a ClearView® db Photometer
Purpose
Continuous measurement of ethylene glycol in diethylene glycol using a near-infrared (NIR) ClearView db fiber optic filter photometer.
Background – Monitoring Diethylene Glycols
A diode array spectrometer was used to measure the NIR spectra of ethylene: diethylene glycol (EG:DEG) mixtures. Low-OH fiber optic cables were used and the samples were measured in a 10 mm glass cuvette at room temperature. To test the viability of a photometer for the real time monitoring of ethylene glycol in diethylene glycol. Results.

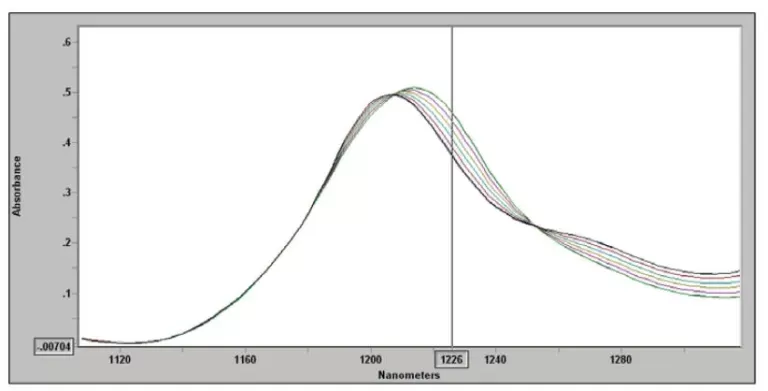
Figure 1: . NIR Spectra of Ethylene-Diethylene Glycol (EG:DEG)
The resulting spectra are shown in Figure 1 for 0, 2, 20, 40, 60, 80, 98 and 100 wt% EG in DEG. Our analysis indicated that 1226 nm (shown by the vertical line) provided the best single wavelength solution for the ClearView db process photometer. This is the 2nd C-H overtone region, which shows the different C-H vibrational character of the two compounds. It was chosen outside the water regions to minimize interferences. Excellent linearity is achieved, as shown in the observed vs. predicted EG plot in Figure 2. A standard error for the regression of 0.46% EG was achieved for the 10 mm optical path. Online precision is expected to be comparable to a process GC.

Conclusion
The ClearView db can match the typical 1% FS performance of a process GC at about 2/3 the price with lower maintenance costs. Compared to a GC, ClearView db’s data update is virtually continuous. With its small size, its installation costs are half of typical GC installation costs. The only maintenance required is changing the lamp every 4-6 months, and a periodic probe cleaning.
Figure 2: Residual Analysis
Questions? We’re here to help.

Support: info@process-insights.com
TERMS AND CONDITIONS
TERMS AND CONDITIONS FOR SERVICE
SELLERS AGREEMENT
DATA PROTECTION
FRAUD ALERT
CHINESE
SITE MAP
-
Technology
Products
Blog
Applications
Application Questionnaire
ISO 9001 Certificates
Copyright © 2022 Process Insights, Inc. All Rights Reserved.