International Electrotechnical Commission System for Certification to Standards Relating to Equipment for Use in Explosive Atmospheres (IECEx System)
The fact that many countries operate under different standards means that Ex equipment often needs to be re-tested and re-certified to the appropriate standards of that country, adding to the cost of the equipment. The IECEx scheme significantly reduces the need for re-testing and certification by conforming and harmonizing to IEC standards, and therefore makes international trade easier, quicker and more cost-effective. IEC standards are used in many national approval schemes and as such, IECEx certification can be used to support national compliance, negating the need in most cases for additional testing.
Similar to the IECEx standard, ATEX is the European Union specific directive for protection in explosive atmospheres.
By becoming ATEX certified Guided Wave can manufacture and sell spectroscopy based analyzers for environments known or expected to be filled with explosive and combustible gasses in the EU.
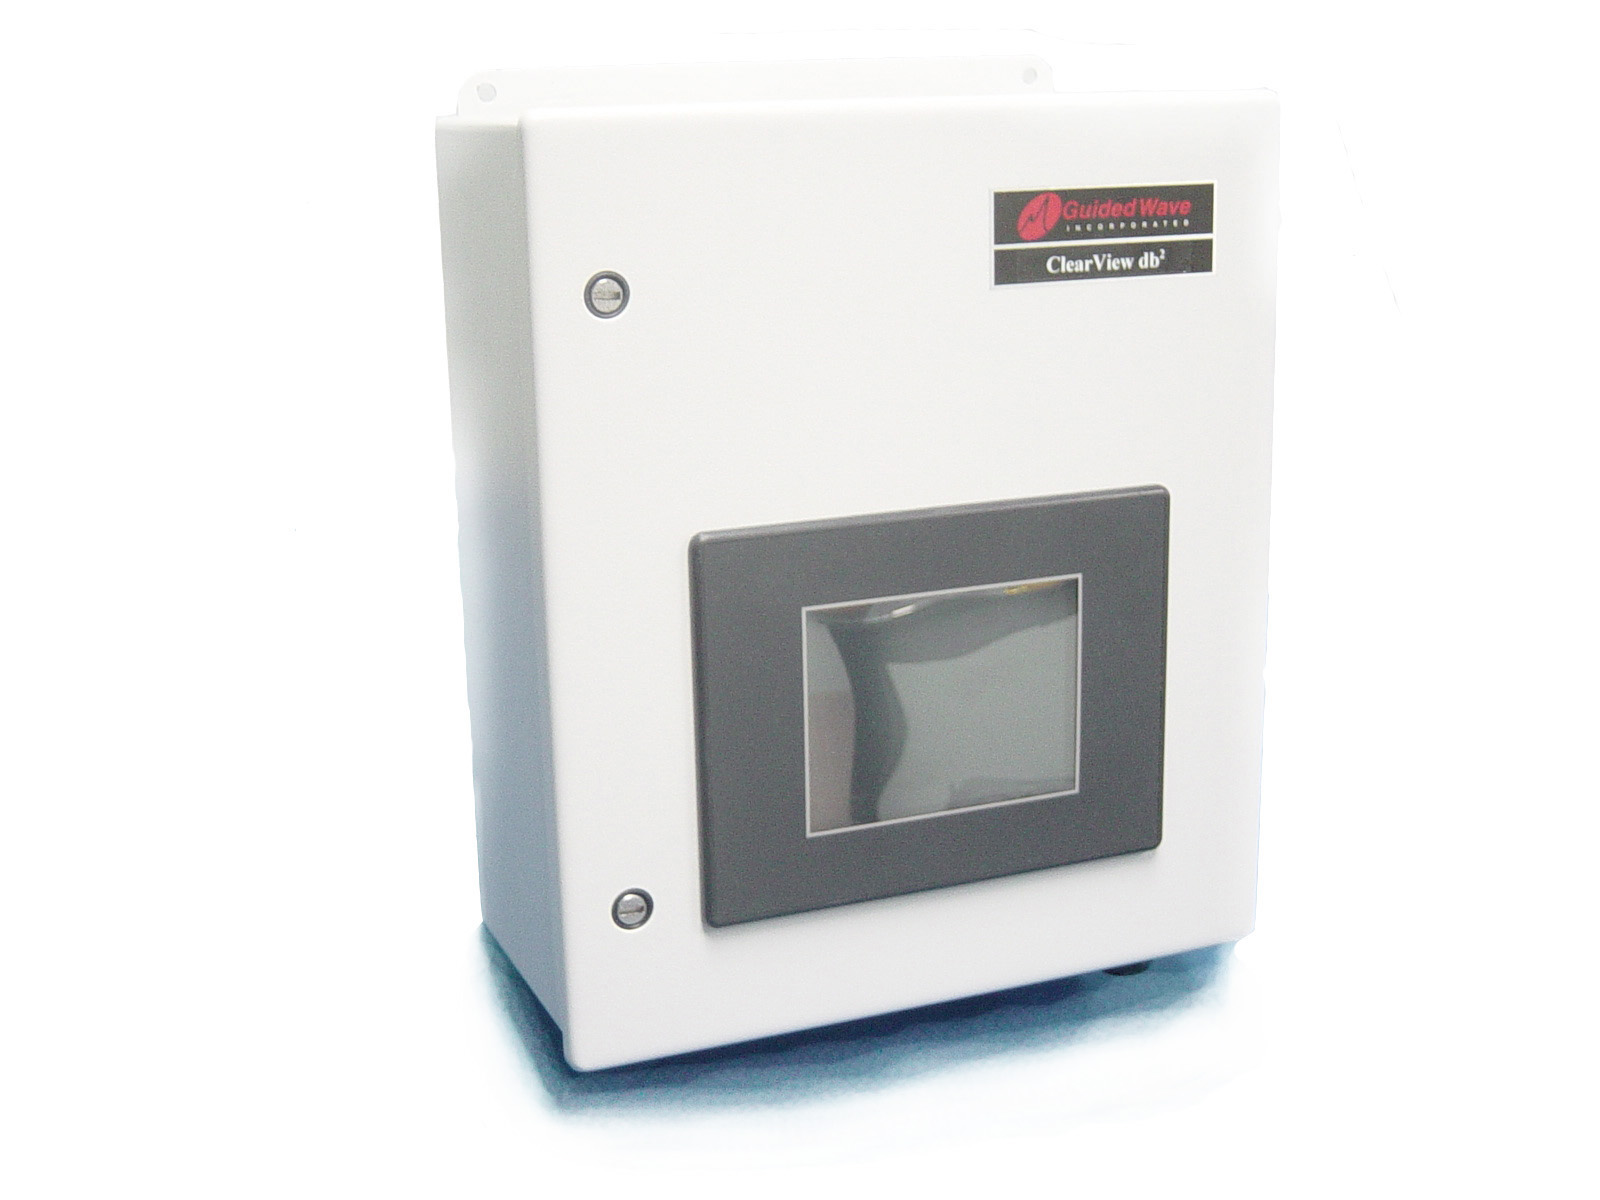
Guided Wave sells and manufactures several dual certified analyzers; The NIR-O Full Spectrum Analyzer, The Clearview db Photometer, and The Hydrogen Peroxide Analyzer.
NIR-O Dual Certification
Guided Wave’s is proud to announce the completion of dual certification for IECEx and ATEX electrical safety for the NIR-O Full Spectrum Analyzer. By completing the certification process, customers can rest easy knowing that Guided Wave’s products can be safely installed in Class 1 Div 1 Zone 1 and Class 1 Div 2 Zone 2 environments.
NIR-O provides excellent signal-to-noise ratio, wavelength stability, NIST traceable wavelength calibration, dual beam optics and built-in diagnostics. Process engineers, operators, and researchers will appreciate NIR-O’s ability to monitor up to 12 process streams or points within a stream with accuracy, repeatability, and reliability. Additionally, the optional Stability Monitor System can provide confidence in hardware performance in the field.
Complete NIR Analyzer System
NIR-O is the core of a comprehensive process analyzer system that includes the spectrometer, one or more NIR probes, fiber optic cables, and OmniView™ scanning and analysis software. Like our previous Guided Wave spectrometers, NIR-O uses infrared radiation to collect spectral data from liquids, gases, glass, and polymer-based films. The spectral data are interpreted by the OmniView software to determine the composition or physical characteristics of the material.
NIR-O Certification Options Include:
- Z-Purge package: Class 1 Zone 2 Groups IIB+H2 (ATEX certification approved, IECEx certification approved)
- X-Purge package: Class 1 Zone 1 Groups IIB+H2 (ATEX certification approved, IECEx certification approved)