• Home
  • Terri Melle-Johnson

Author: Terri Melle-Johnson

Stability Monitoring System Technology Ensures Validated Results

Stability Monitoring System Technology Ensures Validated Results

Spectrum of SMS Filter

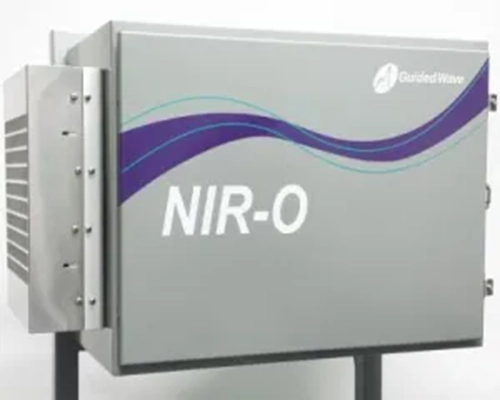
An important consideration for successful process monitoring is the ability to continually validate the performance of the hardware components in the analyzer system. Technological advances with hardware and software have allowed Guided Wave to incorporate a Stability Monitoring System (SMS) in Guided Wave’s NIR-O analyzer. This hardware/software package continuously monitors the analyzer hardware performance to ensure the analyzer is producing validated spectral data.

Continuous, Simple, No Consumables

SMS provides an advantage over other systems. For example, with FT-NIR analyzers, validation is often done using external fluids (i.e., Pentane and Toluene) which may not be readily available and are an expensive consumable. With a Guided Wave NIR-O analyzer the SMS validation system is simple and requires no maintenance or consumables. Using SMS there is no need to interrupt the other channel operation. It provides automatic and continuous analyzer validation according to ASTM methodology.

SMS Validation Detects Changes in Performance

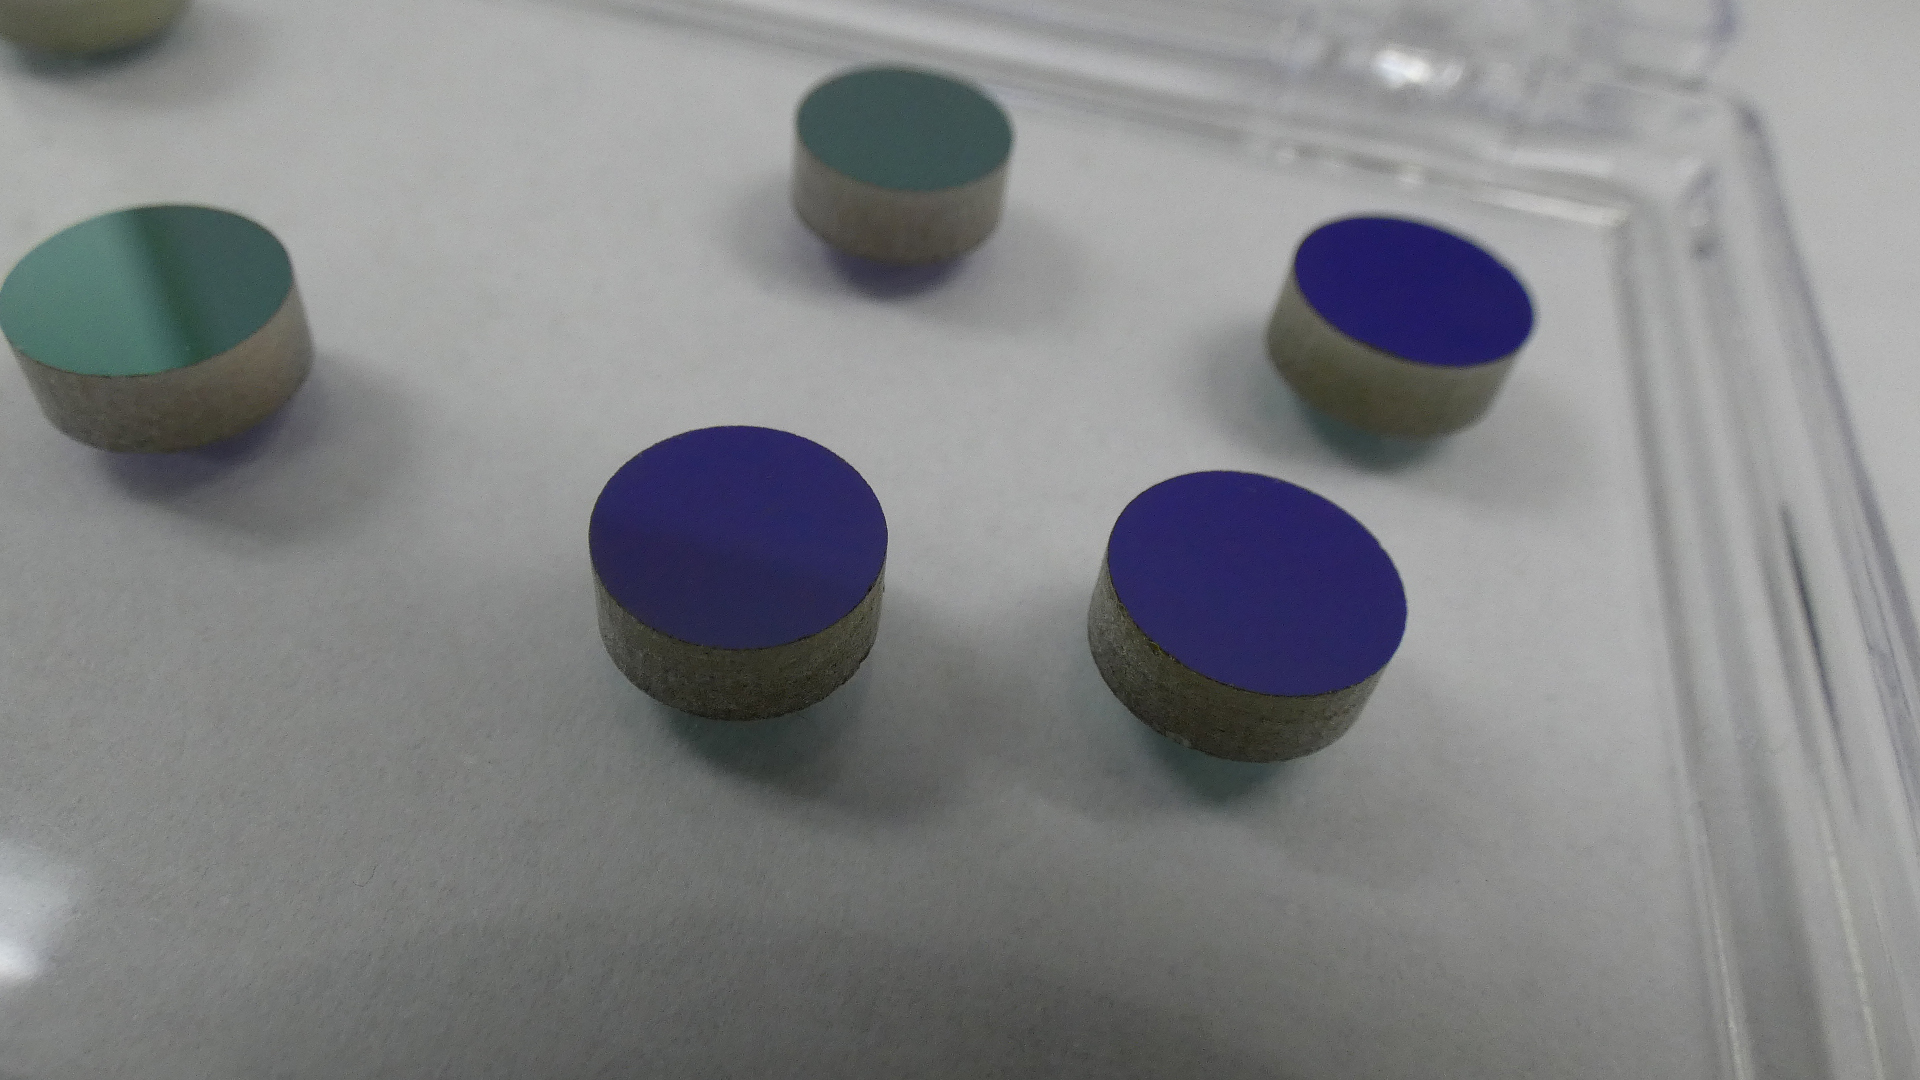
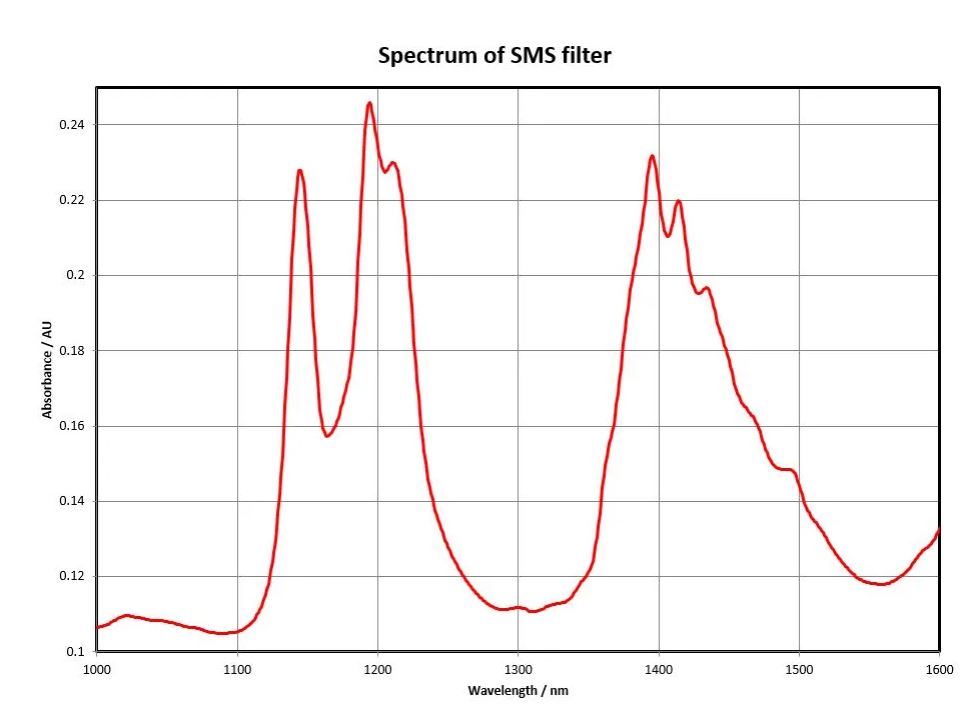
The performance tests identified in the ASTM D-6122 validation practice are diagnostics that can be used to detect changes in analyzer performance. This validation provides assurance that the measurement produced by the analyzer is a result of equipment that is operating properly. Since this is a hands-off procedure, it can be conducted in the background with no human intervention. The validation is done with an internal filter having a characteristic spectral signature. There are no liquids or other external sampling modes that are necessary. Everything is contained inside the
NIR-O analyzer enclosure and all SMS related materials are completely non-hazardous. This topic is addressed in ASTM practice D-6122-19 under
instrument performance tests. The ASTM practice provides a set of criteria for establishing baseline analyzer performance validation. Three levels of hardware testing are established:
Level 0 – When Level 0 – Tests the analyzer hardware’s capability to generate a consistent spectrum. This is accomplished by measuring photometric noise, baseline stability, spectral resolution, photometric linearity, and wavelength stability.
Level A – Tests compare key parts of the spectral data with historical data to identify deviations.
Level B – Tests and monitors the instrument performance for deviations that affect the system calibration models.

Built-in SMS Provides Peace of Mind

Guided Wave’s SMS operation is seamlessly integrated into the OmniView control software for NIR-O. SMS provides assurance that all ASTM required measurements are conducted at the appropriate time and will send a signal or message to the control system if a validation issue is encountered. Learn more about SMS.

Questions? We’re here to help.

Contact Us

Continue reading

Talk to the Experts: Navigating ASTM Validation Practice (D6122) and Process Analysis Implementation Strategies

Talk to the Experts: Navigating ASTM Validation Practice (D6122) and Process Analysis Implementation Strategies

ASTM lighthouse

Questions? We’re here to help.

Contact Us

Continue reading

The Refinery of the Future – Targeted Petrochemical Production

The Refinery of the Future – Targeted Petrochemical Production

Oil and Energy Companies stock investments

Oil and Energy Companies Stock Investments, Industry Future

According to the February 20, 2019 issue of Chemical & Engineering News, “The Future of oil is in Chemicals, Not Fuels”, Saudi Aramco, BP, and other major oil producers and refineries are forecasting a decrease in the demand for fuel. Their rationale for the decline is that the adoption of electric cars and improved fuel economy cars, will decrease demand for barrels of oil dedicated to transportation fuel.

In an effort to stay competitive some oil producers are evolving their refining processes to target the production of specific chemicals. For example, ExxonMobil has developed a system which allows crude oil instead of naphtha to be processed by a stream cracker.

Steam Cracker

By creating variations in existing locations or processes in the refinery, valuable chemicals can be selectively created, purified, and sold in bulk.

Questions? We’re here to help.

Contact Us

Continue reading

Time to Upgrade Your M412 Analyzer? Key Points Your Proposal Needs to Include

Time to Upgrade Your M412 Analyzer? Key Points Your Proposal Needs to Include

M412 Upgrade Path

Over 20 years ago Guided Wave debuted the Model 412 near-infrared (NIR) process analyzer (M412). In 2016, with advances in technology and our pioneering experience in the spectroscopic analysis industry, the M412 was replaced by NIR-O. NIR-O provides better performance, advanced operations, and improved ROI.

There are 2 Options for Adopting a NIR-O Spectrometer for Existing M412 Users:

1. Retrofit your M412 Enclosure with the New NIR-O Spectrometer

The NIR-O Spectrometer can be retrofitted into any existing M412 installation. Simply schedule downtime for the analyzer, remove the M412 spectrometer and related elements, and follow the retrofit installation guide. Within a few hours, your NIR-O will be up and running in your existing enclosure and properly communicating with your DCS. Contact a Guided Wave sales representative to receive a quote for this special Retrofit Upgrade.

2. Purchase a Fully Certified IECEX, ATEX, or CSA Certified NIR-O

The retrofit of the M412 enclosure may invalidate any hazardous environment certifications for the M412. The state-of-the-art NIR-O has model certification for both IECEX and ATEX. Additionally, a CSA field certified design is available. Contact a Guided Wave sales representative to receive a quote to upgrade to a certified NIR-O full spectrum analyzer.  

Cost Reducing Considerations for Upgrading to NIR-O

Compared to new system installations, substantial savings can be realized by either retrofitting the M412 or purchasing a complete NIR-O analyzer system. There are 5 top cost-saving justifications to include in your project proposal. These include the:

  1. Ability to reuse existing probes and fibers
  2. Transferability of current chemometric calibrations
  3. The NIR-O requires 90 Watts less power than the M412
  4. Omniview software provides enhanced support for modern security protocols
  5. Improved User Interface, embedded touchscreen, and FREE software training videos – reduce learning curve for users
  6. Convenient spare parts service plan – Wave Care

NIR-O Analyzer NIR Spectrometer

Reuse Existing Probes and Fibers

Guided Wave designed the NIR-O to be optically matched with existing M412 fibers, flow cells, and insertion probes. As a result, Guided Wave can offer a more cost-effective upgrade path to existing users. Reusing the probes and fibers from the M412 allows the NIR-O upgrade to be dramatically less expensive.

Keep your Existing Chemometric Calibrations

The chemometric calibration models in use on the M412 can be efficiently updated by Guided Wave staff for use on the NIR-O analyzer system. A calibration update reduces the opportunity cost associated with modernizing your analyzer.

Improve Security via OmniView Software

The Class PA software utilized by the M412 has provided users with years of trouble-free operations. However, security concerns and best practices were completely different 20 years ago. By upgrading to the NIR-O analyzer and associated OmniView software, your IT staff can rest assured knowing that the key analyzer software meets today’s vigorous security protocols.

Library of Online Support Videos and Training Materials

As part of the product launch for the NIR-O, Guided Wave developed a wide range of support videos hosted on our YouTube channel. In addition, we have NIR-O qualified support engineers available to help with startup and other troubleshooting issues.

Spare Parts and the WaveCare Support Program

The NIR-O spectrometer was designed specifically to address the service issues associated with the M412’s input module and shutter assembly. These design improvements have resulted in a dramatic decrease in the amount of service work required, resulting in more uptime for the NIR-O analyzer.  Additionally, contact us about the WaveCare Support Program which provides users with improved lead time on spare parts and service calls to further ensure uptime.

Contact a Guided Wave sales representative to save money and time by either retrofitting your M412 or purchasing a new NIR-O analyzer system.

Questions? We’re here to help.

Contact Us

Continue reading

Understanding the difference between PONA and PIONA

Understanding the difference between PONA and PIONA

Guided Wave News / By 

Near-infrared (NIR) technology can overcome the major problems associated with real-time inline monitoring of process hydrocarbon streams. In the case of the Naptha Steam cracker and other olefin units in the Refinery, PIONA (Paraffins, Isoparaffins, Olefins, Napthenes, Aromatics) are important properties. Naphtha feed streams can in principle be measured on-line by GC techniques, but the parameter measurements required for effective control include PIONA and %Distillation curve, which require long elution times and the added cost of a sample conditioning system.

PIONA Petrochemcial (Hydrocarbon) molecules measured by NIR Spectroscopy.

PONA vs PIONA, what’s the difference?

PIONA is a more exact measurement standard. PIONA considers n-paraffins and isoparaffins to be different.  N-paraffins have long straight chains and provide higher cetane values for diesel fuels. The melting point of n-paraffins often occurs between 230-370°C, which results in a worsening of the cold flow properties (cold filter plugging point, pour point) of the diesel fuel. Isoparaffin molecules, such as iso-butane, contain branched side chains. As a result, isoparaffins increase the viscosity, lower pour point, and increase the octane of the fuel. The ratio of n-paraffins to iso-paraffins is an important parameter in some fuel blending operations.

Questions? We’re here to help.

Contact Us

Continue reading

Utilizing the Direct-Digital MODBUS interface for ClearView db – OEM Applications

Utilizing the Direct-Digital MODBUS interface for ClearView db – OEM Applications

ClearView db is a modular filter photometer suitable for many OEM applications. By selecting up to six filters ranging from 420nm to 2100nm each with a dedicated detector, system integrators have successfully utilized ClearView db for real-time monitoring of liquids and gasses. Examples include: acid & OH number monitoring, detection of copper in acid baths, hydrogen peroxide vapor sterilization, NO2 gas sterilization, water content of solvent or gasses, or color. Additionally, the ClearView db can monitor up to 2 process locations using either flow cells or direct insertion probes.

Guided Wave provides OEM partners with a detailed MODBUS TCP/IP map and implementation examples. This data enables system integrators to quickly incorporate the ClearView db into their existing projects. MODBUS enables directional communication and remote operational control of the analyzer. Commands include: taking a reference, zero, or background scan; applying a slope and bias correction to the measurement result; and alarms or errors. For example, analyzer faults or off spec process alarms. ClearView db monitor does not require an external computer for configuration and operations, Modbus TCP/IP communication is completely integrated into the system and does not need extra software or hardware from a third party supplier

Ultimately by implementing the OEM ClearView db photometer with MODBUS, critical process monitoring information can be quickly delivered to process engineers and other end-users. Allowing your customers to make informed decisions in real-time.

Interested in learning more about the OEM process for the ClearView db?

Understanding MODBUS Bit Fields in the ClearView db

The ClearView db does not implement MODBUS bit commands such as Read Coils, Write Coils or Read Input bits. To reduce computational time, the ClearView db instead employs the use of bit fields in unsigned 16 bit words. The table below displays a partial MODUS map for the ClearView db. A complete MODBUS map is provided to OEM partners.

ClearView db Modbus Address 40003 Read / Write Example

BitNameDescription
0RunThe Run bit is set at power up and should be set at all times except during configuration changes. This bit is cleared when the touch screen configuration menu is accessed and set upon exit from the configuration menu screen. When Run is cleared the analyzer will no longer calculate Transmission, Absorbance, Answers or update Analog Output values.
1Referencing ASetting this bit will cause the analyzer to Reference / Zero Channel A. The bit will auto clear when completed. The Run bit must be set for this command to work properly.
2Referencing BSetting this bit will cause the analyzer to Reference / Zero Channel B. The bit will auto clear when completed. The Run bit must be set for this command to work properly.
3Configuration ActiveThis bit is set by the touch panel when the configuration menus are being accessed and cleared when the configuration screens are exited.
4Program SaveSetting this bit will cause the analyzer to save all of the answer configuration settings currently in RAM into EEProm. This bit will auto clear when completed. The Run bit should be cleared before setting this bit and then set after completion.
5Program LoadSetting this bit will cause the analyzer to load all of the answer configuration settings from EEProm into RAM. This bit will auto clear when completed. The Run bit should be cleared before setting this bit and then set after completion.
6Hardware Save
Factory Use Only
Setting this bit will cause the analyzer to save all of the Factory configuration settings currently in RAM into EEProm. This bit will auto clear when completed. The Run bit should be cleared before setting this bit and then set after completion. Factory settings apply only to installed components that cannot be changed in the field.
7 - 14Not used
15Analog Output TestSetting this bit cause the analyzer to enter Analog Outputs Test mode. This test cycles the 4-20mA outputs continuously 4ma, 12mA and 20mA for several seconds each until cleared.

Questions? We’re here to help.

Contact Us

Continue reading

Vaporized Hydrogen Peroxide – Applications and Monitoring Solutions

Vaporized Hydrogen Peroxide – Applications and Monitoring Solutions

Sterilizing medical instruments in autoclave

Questions? We’re here to help.

Contact Us

Continue reading

What are you Measuring? When to know if Process Spectroscopy is the Measurement Technology you should use.

When to know if Process Spectroscopy is the  Technology you need for Liquid, Vapor or Gas Measurements?

Use this flowchart to figure out if process spectroscopy is the best measurement technology for your application.  If you reach the purble box (I don’t know) in this flowchart you can complete the Application Questionnaire and the experts at Guided Wave will help you. There is also more information on the how to select an analyzer page. Want to send us a question? Use the contact us button below.

When to Know if Process Spectroscopy is the Technology for Liquid, Gas or Vapor Measurements

Which Process Spectroscopy Analyzer did you Choose?

Select the product name below for more information about each of these Guided Wave and ANALECT analyzers: 

Flowchart

QUESTIONS? WE’RE HERE TO HELP.

contact us

Continue reading

What’s a Photometer filter kit and how can it help me save money?

What’s a Photometer filter kit and how can it help me save money?

Solid state filters are used in the ClearView db analyzer. The apparent color change represents different wavelength ranges. These filter are installed inside of the filter wheel in the ClearView db Analyzer

The ClearView db process analyzer is a photometer-based sensor platform. Before shipment, each platform is configured in Guided Wave’s factory to monitor specific conditions or applications specified by the end-user. The Clearview db provides a cost savings alternative to purchasing a process grade spectrometer. The cost savings are achieved by selecting (at the time of purchase) up to six filters, which are part of the analyzer’s hardware.

Each filter is chosen based upon the compounds to be measured. Every filter allows a ~10nm wide wavelength band of the analyzer light to reach the detector. All other light is essentially blocked by the filter. These filters are then installed inside the ClearView db, locking in the hardware portion of the calibration (The wavelengths that are measured). The software calibration is typically done in Microsoft Excel by the factory and converts the intensity of light for each filter/wavelength into the predicted answer.

The ClearView db delivered to the end-user is essentially customized for their specific purpose. The end-user may later modify the software portion of the calibration to adapt the analyzer for other requirements. For example, an offset or slope correction can be added to fine-tune the calibration based on data after installation at the customer site.

How Guided Wave Selects Filters?

Guided Wave has developed filter kits for many applications. For new applications, samples must be collected and scanned with a spectrometer (400-2100nm). Wavelength ranges that correlate well with the chemical changes are identified and compared against our stock of available filers for the closest match.

Each filter allows a narrow range of wavelength to be transmitted to the photometer detector. This is typically referred to as the bandwidth of the filter. Above are 4 proven photometer applications by wavelength represented by the red, gray, blue and yellow dots. By measuring these wavelengths we can monitor the specific application at a reduced cost in comparison to a full spectrum analyzer.  

If Guided Wave does not have a corresponding filter, a custom filter can be ordered from our vendor and added to our inventory to meet application demands.

The Anatomy of the ClearView db Analyzer

The photometer both transmits the source light and quantifies the light that was not absorbed by the sample. Optical grade fiber cablesare used to carry the light from the photometer to the sample and back. Using high-performance fiber cables permits the sample interface to be located up to 100 meters from the photometer.

The ClearView db can be divided into four major sections 

1) Electronics (Detector PCA):  the desired (analog inputs and outputs, Modbus interface, and Human Interface Display (touch screen)

2) Lamp Housing:  area of the light source.

3) Optical Multiplexor: (MUX): which programmatically switches between the reference and sample fiber optic cables. The reference fiber is our Dual Beam (db). It allows for automated corrections due to instrument noise and improves performance.

4) Detector Housing:  area where the filters and detectors are installed by Guided Wave at the factory (the graphic below shows 2 of the 6 possible filters).

ClearView db Photometer -Filter

Questions? We’re here to help.

Contact Us

Continue reading

Writing Custom Python Scripts in OmniView Part II

Writing Custom Python Scripts in OmniView Part II

Writing Custom Python Scripts in OmniView Part II

In part I of Writing Custom Python Scripts in OmniView, we discussed setting up a basic python script and determine the absorbance value at a specific wavelength. As shown in our training videos we recommend customers use Unscrambler Prediction Engine to implement PLSR or PCA calibrations. We also have a video demonstrating how to turn on additional statistics, such as Mahalanobis Distance.

When additional statistics are turned on, instead of returning a single floating point value, the Unscrambler Prediction Engine will return a python dictionary or array of answers (predicted properties). If you are operating near zero, the calibration may return a negative result. In many applications the answer, such as the concentration of water in a solvent, the real world value can never be less than zero. Therefore you may want to add some logic to your python method script to overwrite negative values and set them to zero.

The code below can be added to your custom python method script. Please note the tab indentation. Proper spacing is important in python syntax.

answer = unscramble(au)

for key in answer.keys():
    if answer[key] < 0:
        answer[key] = 0

Interested in learning more? Check out the training videos we have on our youtube channel.

Questions? We’re here to help.

Contact Us

Continue reading