Vaporized Hydrogen Peroxide is one of the few sterilization methods that is effective for virus deactivation and microbial reduction. This blog post discusses various aspects of the sterilization market and the need for spectroscopic monitoring equipment for validating hardware and sterilization cycle design.
Reducing Nosocomial or Hospital-Acquired Infections, Miniaturizing Technology for Table-Top Office Sterilizers
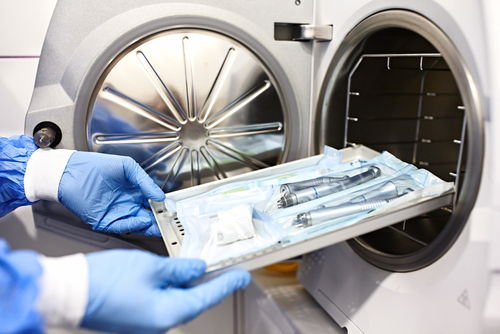
The future of the sterilization market is in small semiportable sterilization isolators geared towards doctors’ offices and other front-line medical personnel. The driving force behind the adoption of this technology is the reduction of nosocomial or hospital-acquired infections. Medical equipment is routinely disinfected with alcohol between each patient, but that is not always enough to properly disinfect the instruments. By placing medical equipment, such as a stethoscope into a microwave sized chamber, medical staff can be assured that the item is properly sterilized. If a protocol is established to effectively and efficiently sterilize equipment after each patient is treated nosocomial infections will be reduced.
Using Spectroscopy to Compliment Rapid Biological Indicators
Biological indicators (BI) are the final go/no go of sterilization testing. By placing biological indicators in the sterilization chamber with the load (product to be sterilized), technicians can verify to regulatory standards that a kill dose of sterilant was received. Guided Wave’s HPV analyzer was developed to complement BI technology, by providing a real-time read-out of the sterilant concentration. If a biological indicator shows that a kill dose was not received the data produced by the Hydrogen Peroxide Vapor Analyzer can be used to help explain what went wrong with the sterilization cycle. By combining biological indicators with spectroscopy, engineers designing the next generation of tabletop sterilizers can reduce the time to market for new products.
Benefits of Simultaneous Measurement of Water Vapor and Peroxide Vapor Concentration
A critical parameter during sterilization cycle development and validation of new sterilization hardware is that the product’s (item to be sterilized) surface is exposed for a minimum amount of time to the correct concentration of sterilant. In the case of vaporized hydrogen peroxide, one parameter to consider is the decomposition rate of hydrogen peroxide to water. By simultaneously measuring the water vapor and the hydrogen peroxide vapor, reaction kinetics can be determined.1 Spectroscopy is an accurate and reliable method to simultaneous determine water and hydrogen peroxide vapor.
The reaction kinetics (adsorption, absorption, and decomposition) of vaporized hydrogen peroxide (VHP) in a vacuum isolator will deviate from theoretical calculations as calculated by a mass balance equation.2 The Hydrogen Peroxide Vapor Analyzer uses near-infrared spectroscopy to measure the actual VHP and water vapor concentrations, corrections to reaction kinetics can be determined.
If Hydrogen Peroxide and Water Vapor exceed the Relative Saturation (RS) where condensation occurs within the Sterilization Chamber, fouling of packaging of products being sterilized can occur. Furthermore this condition usually violates the strict protocols associated with proper elimination of the bio-load. While the G-SST probe is water resistant when installed properly, the probe may not function optimally during condensation conditions. Actually the probe may become a good predictor should RS max be exceeded and a condensation fog exist.
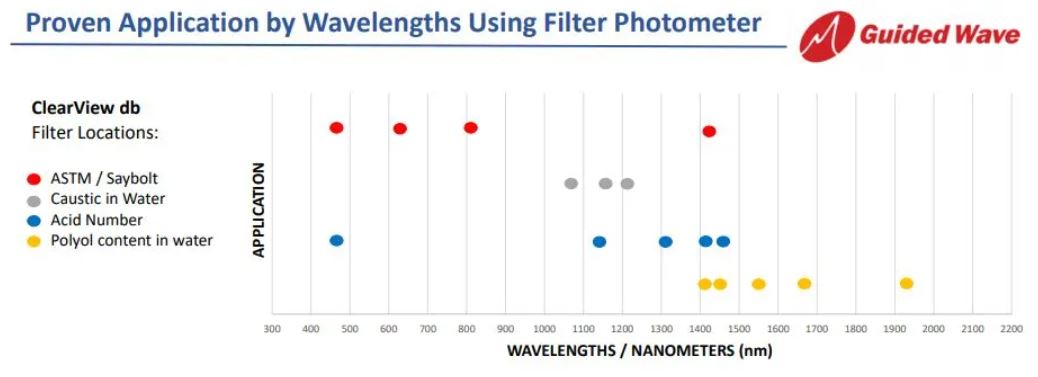
According to the scientific study by Corveleyn3 spectrally gaseous Water (H2O) has near-infrared absorbance peaks located at 1364 nm, 1378 nm, and 1400 nm. Whereas Hydrogen Peroxide Vapor (H2O2) was determined to have an absorbance peak located at 1420 nm. By selecting these wavelengths with the corresponding baseline corrections. The Hydrogen Peroxide Vapor Analyzer is factory calibrated to account for the interference.
Why use Vacuum Sterilization?
Creating a vacuum is a critical part of many low temperature hydrogen peroxide sterilization systems. By pulling a vacuum inside of the sterilization chamber the air and other contaminants are removed. This prevents the air and contaminates from breaking down the hydrogen peroxide vapor prior to it reacting with the bacteria. Additionally, the vacuum enables hydrogen peroxide to be pulsed into the chamber and therefore helps drive the sterilant gas into the packaging material. The vacuum also increases the effectiveness of any aeration at the end of the cycle to neutralize residual sterilant.
Low temperature vacuum sterilization is ideal for sensitive products and BioPharma substances such as those that are protein based. The modern basis for gently handling sensitive products utilizes multiple sterilant pulses with a soak or dwell time before evacuating the chamber. The process of pulsing sterilant into the chamber prior to evacuation can be repeated several times to achieve a proper sterlization levels. This modern approach to vacuum sterlization eliminates the Bio-Burden associated with the products themselves.
Benefits of NIR Monitoring of Atmospheric and Low Temperature Vacuum Sterilization
The Guided Wave Vapor Probe connected to the near-infrared beam of a Hydrogen Peroxide Monitor is invariant to the pressure or velocity of the gas in the probe’s measurement zone. The vapor probe directly measures the number of molecules of H2O2 and H2O that exist in its beam at any particular moment. This real-time measurement is regardless of pressure changes due to injection or pulses of sterilant, chamber pump down, or chamber aeration. NIR is a remarkable measurement approach for Atmospheric and Low Temperature Vacuum Sterilization. Real-Time Data is generated throughout the sterilization cycle(s) and the output is sent to data logs every few seconds, providing a valuable Audit Trail for Cross Validation of System Performance.
Monitoring the Vaporized Hydrogen Peroxide Concentration in Walk-in Vacuum Sterilization Isolators
Walk-in sterilization systems are used for high volume sterilization. Carts or mobile racks of the product can be loaded into and out of the isolation chamber to ensure high throughput. To ensure that proper mixing is achieved several G-SST probes can be placed in the isolation chamber. The data generated by the multiple probes provides a profile gradient that can be monitored during the sterilization process. Determining the sterilant gradient inside of a reaction chamber is an important step in validating the design of the chamber.
Bio-safety Room Decontamination and Virus Deactivation
Similar to isolators, BioSafety labs are large rooms used for biological experiments. Due to the nature of the research conducted, these rooms require periodic decontamination and virus deactivation. The National Cancer Institute (NIH) Research and Production Center at Ft. Detrick, Maryland uses vaporized hydrogen peroxide to decontaminate whole areas and rooms. The NIH facility uses spectroscopy to monitor sterilant levels in hard to access locations. Mounting a G-SST probe instead of a biological indicator in these locations saves time and increases technician safety. Learn more about this customer success story.
References
- https://pdfs.semanticscholar.org/9171/1c2b3ab32a797ac259598be912023a413549.pdf
- Brown, et al., “Calibration of Near-Infrared (NIR) H2O2 Vapor Monitor,” Pharm. Eng. 18, (6), 66–76, (1998)
- Corveleyn, S., Vandenbossche, G.M.R. & Remon, J.P. Near-Infrared (NIR) Monitoring of H2O2 Vapor Concentration During Vapor Hydrogen Peroxide (VHP) Sterilisation. Pharm Res14, 294–298 (1997). https://doi.org/10.1023/A:1012085702372


 Insights, a Union Park Capital portfolio company, announced today that it has acquired Guided Wave Inc. (“Guided Wave”) from Singapore-based Advanced Holdings Ltd. Guided Wave, based in Rancho Cordova, California will join Process Insights’ existing broad portfolio of premium brands and technologies for process analytics, monitoring and control including COSA Xentaur, Hygrocontrol, Alpha Omega Instruments, LAR Process Analysers, Tiger Optics, ATOM Instrument, Extrel CMS and MBW Calibration.