• Home
  • Process Insights

PROCESS INSIGHTS ANNOUNCES ACQUISITION OF GUIDED WAVE INC.

PROCESS INSIGHTS ANNOUNCES ACQUISITION OF GUIDED WAVE INC.

Questions? We’re here to help?

Contact Us

Continue reading

Model 412 NIR Spectrometer Support and Available Parts

Model 412 NIR Spectrometer Support and Available Parts

M412 analyzer

Model 412 NIR Spectrometer

QUESTIONS? WE’RE HERE TO HELP.

contact us

Continue reading

Writing Custom Python Scripts in OmniView Part II

Writing Custom Python Scripts in OmniView Part II

In part I of Writing Custom Python Scripts in OmniView, we discussed setting up a basic python script and determine the absorbance value at a specific wavelength. As shown in our training videos we recommend customers use Unscrambler Prediction Engine to implement PLSR or PCA calibrations. We also have a video demonstrating how to turn on additional statistics, such as Mahalanobis Distance.

When additional statistics are turned on, instead of returning a single floating point value, the Unscrambler Prediction Engine will return a python dictionary or array of answers (predicted properties). If you are operating near zero, the calibration may return a negative result. In many applications the answer, such as the concentration of water in a solvent, the real world value can never be less than zero. Therefore you may want to add some logic to your python method script to overwrite negative values and set them to zero.

The code below can be added to your custom python method script. Please note the tab indentation. Proper spacing is important in python syntax.

answer = unscramble(au)

for key in answer.keys():
    if answer[key] < 0:
        answer[key] = 0

Interested in learning more? Check out the training videos we have on our youtube channel.

QUESTIONS? WE’RE HERE TO HELP.

contact us

Continue reading

Integrating the OEM ClearView db – The Gold Box

Integrating the OEM ClearView db – The Gold Box

ClearView db is a modular filter photometer suitable for many OEM applications. By selecting up to six filters ranging from 420nm to 2100nm each with a dedicated detector, system integrators have successfully utilized ClearView db for real-time monitoring of liquids and gasses. Examples include: acid & OH number monitoring, detection of copper in acid baths, hydrogen peroxide vapor sterilization, NO2 gas sterilization, water content of solvent or gasses, or color. Additionally, the ClearView db can monitor up to 2 process locations using either flow cells or direct insertion probes.

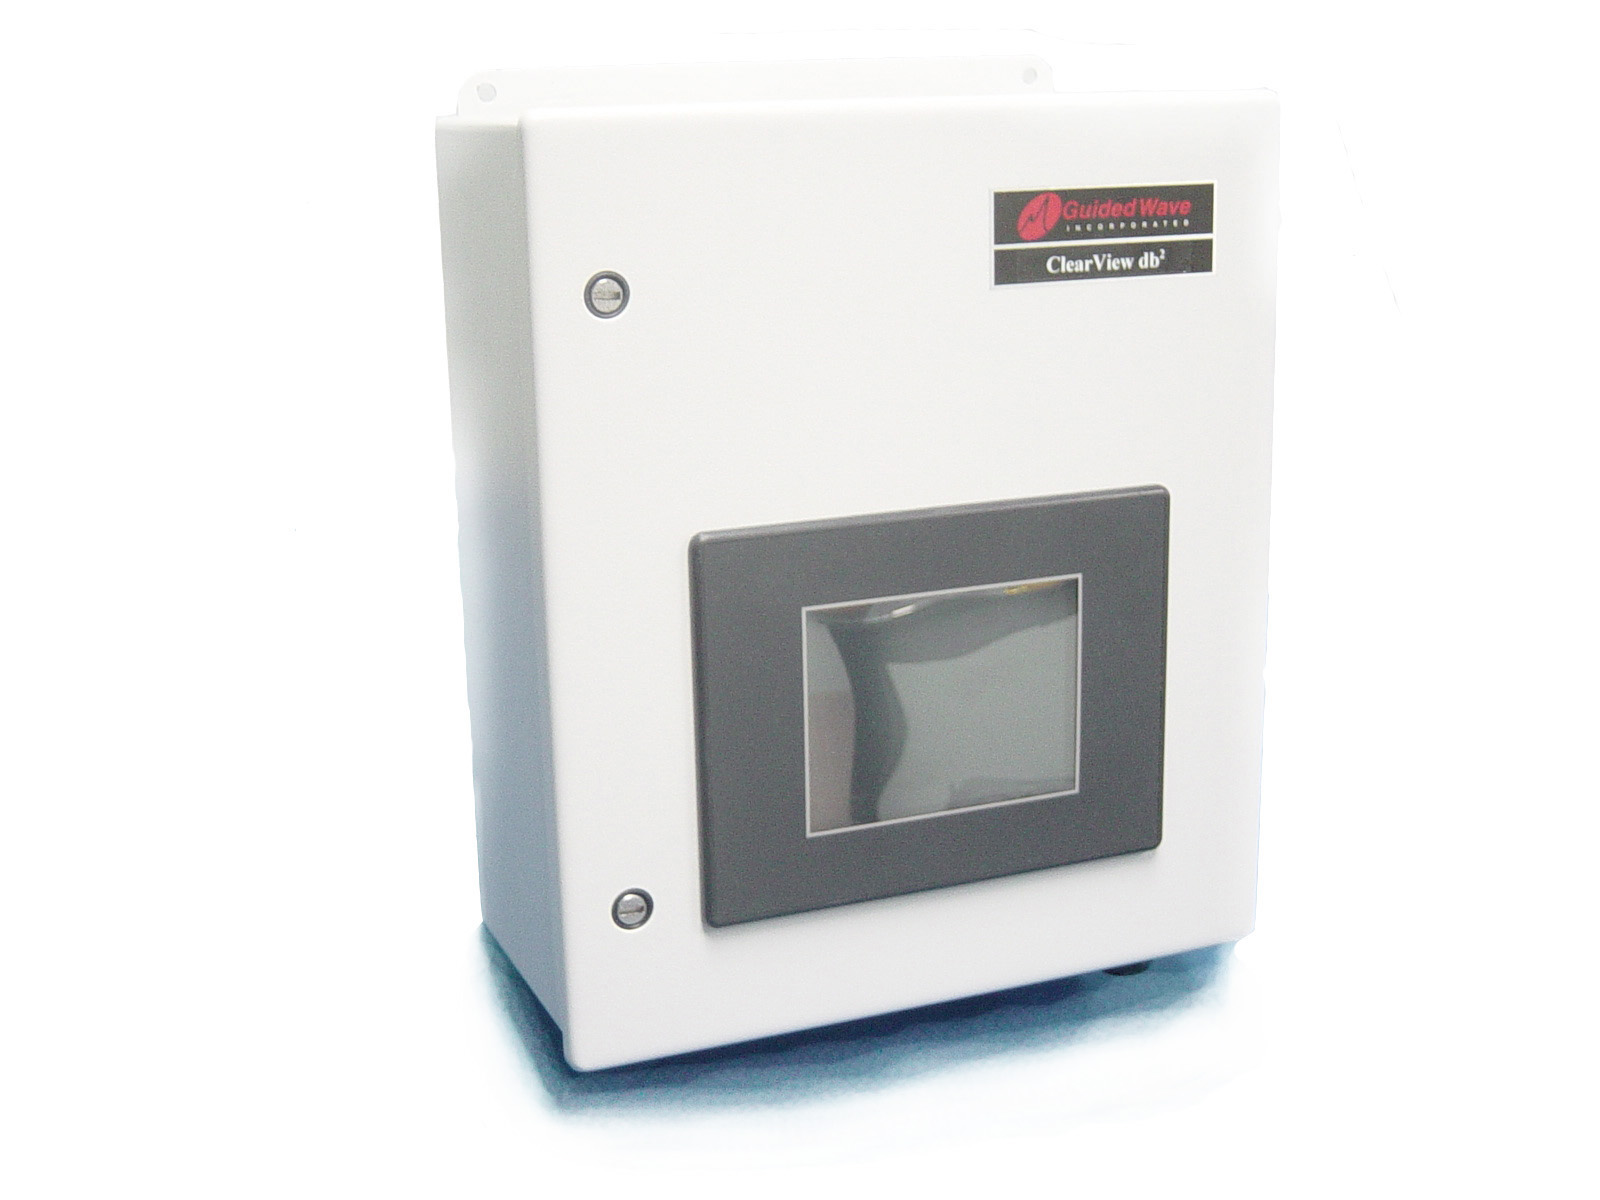
Guided Wave ClearView db photometer analyzer

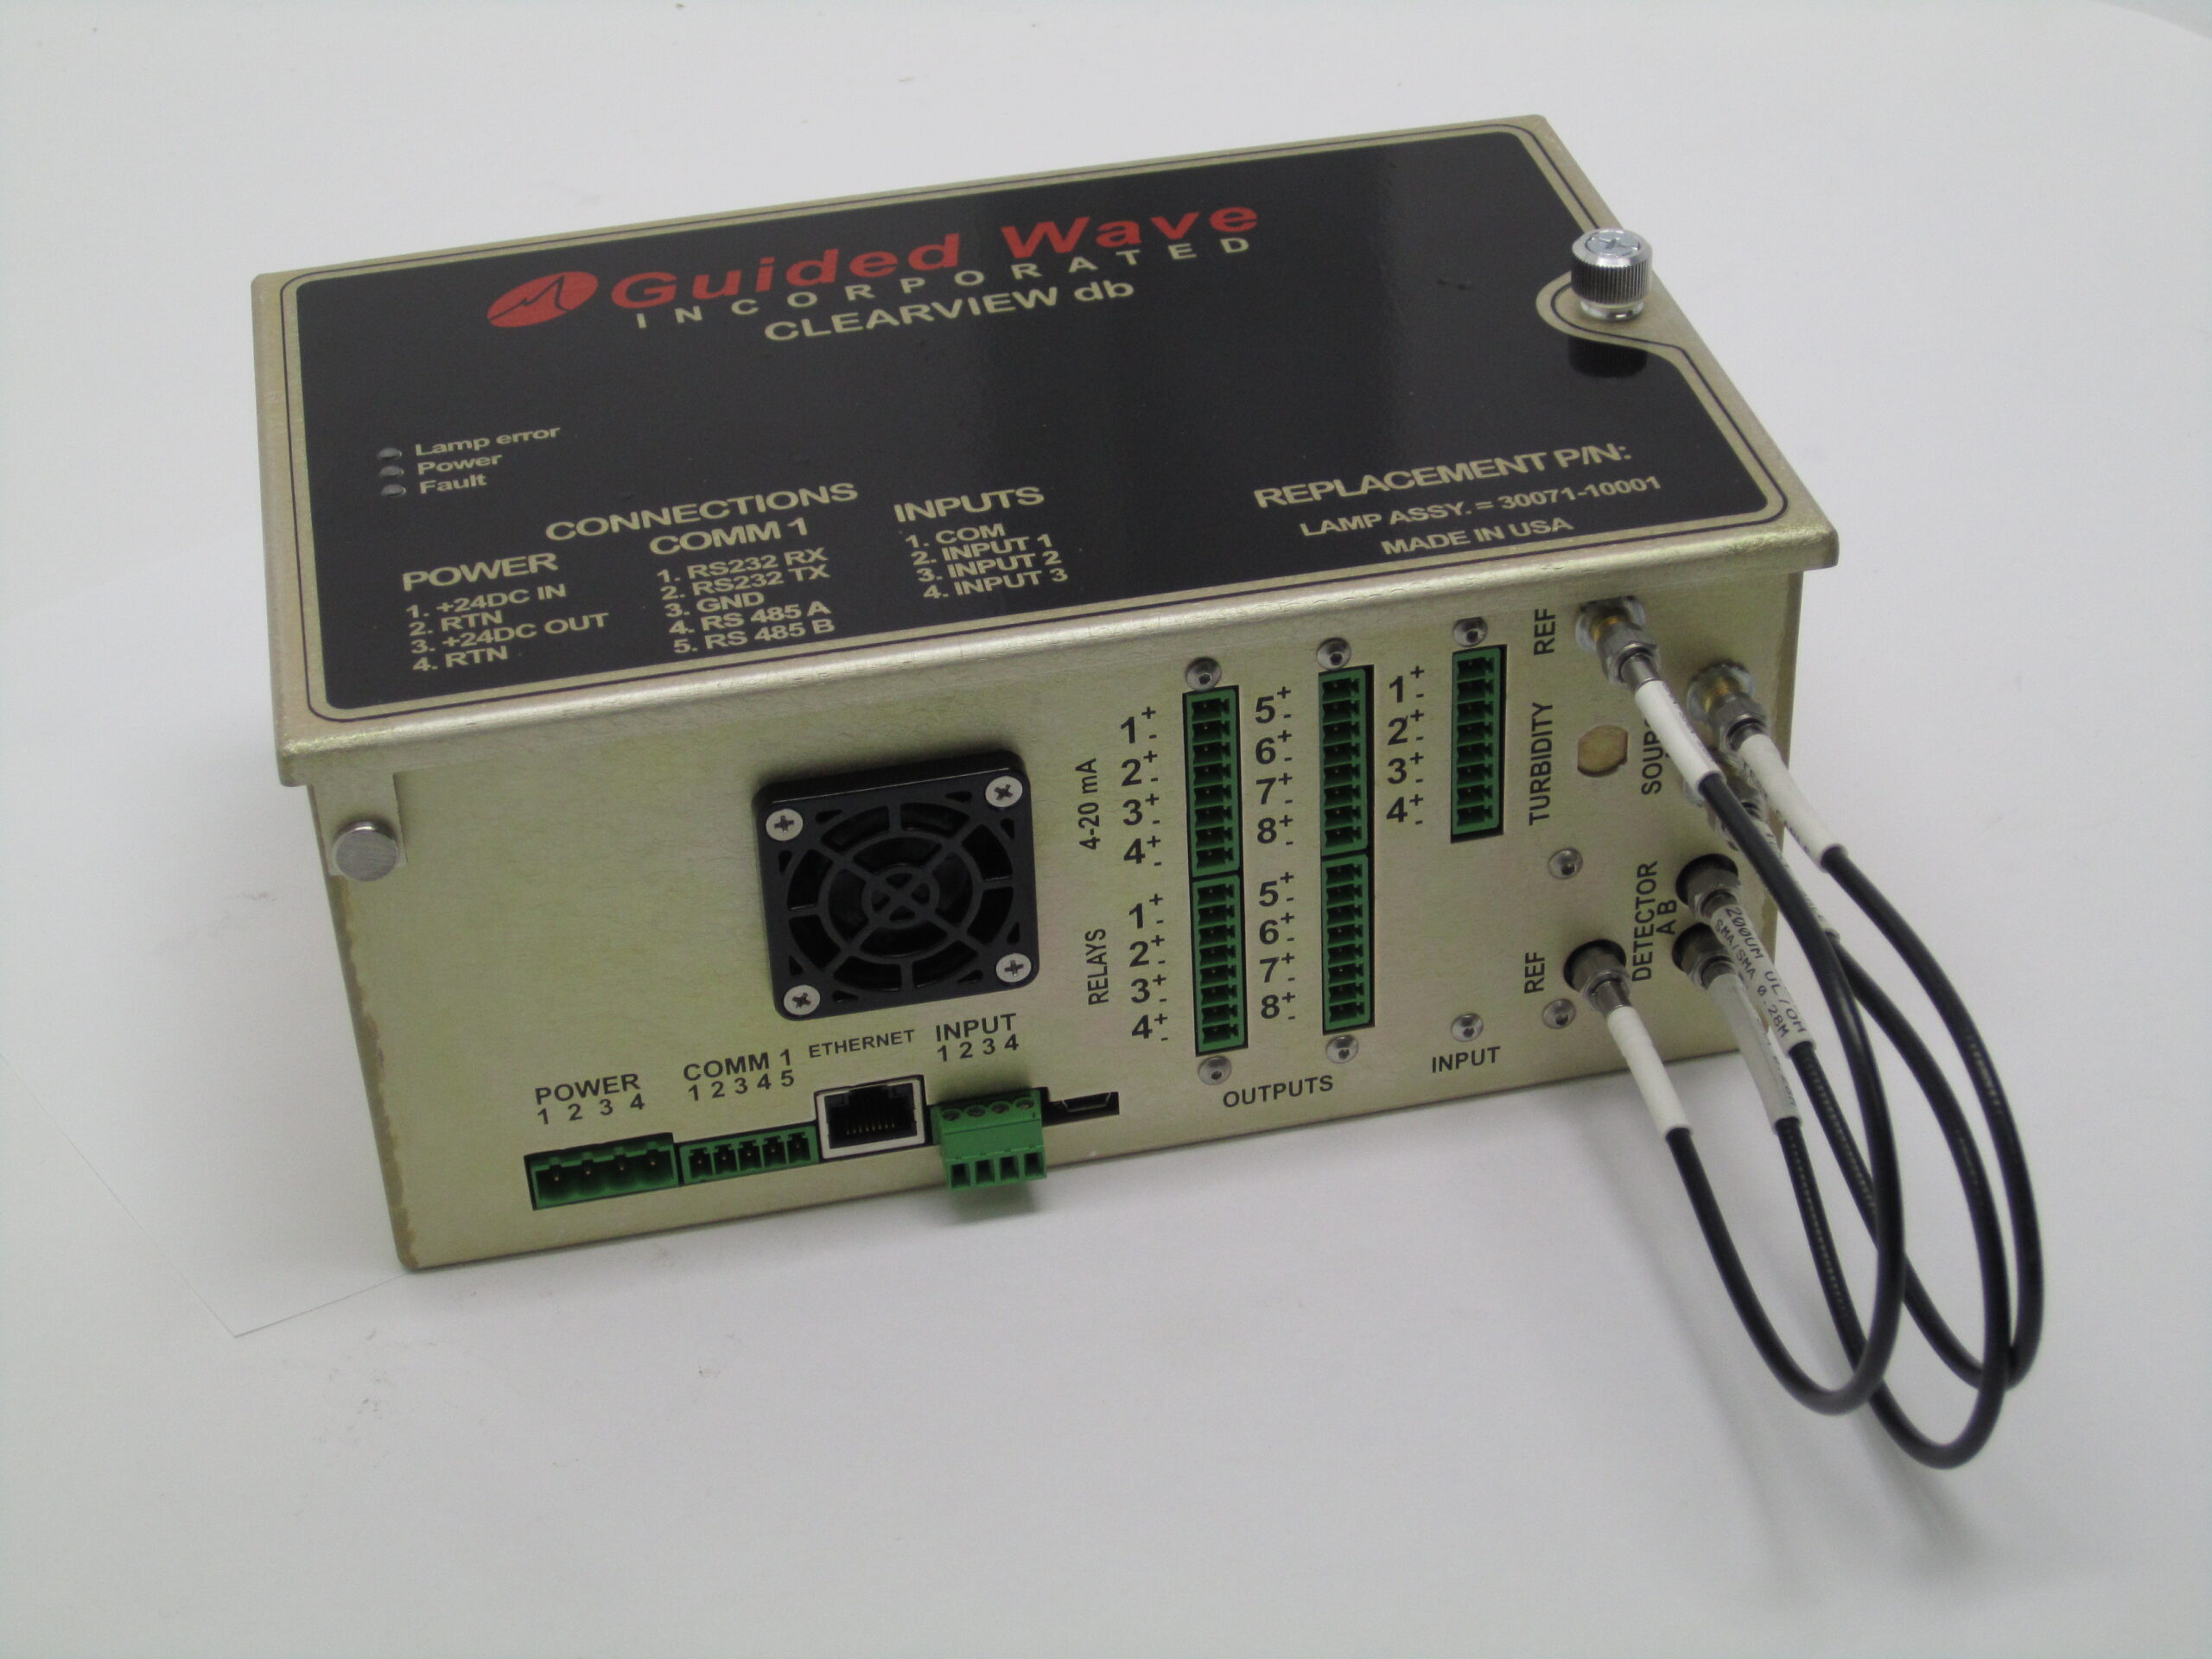
When sold in the OEM form factor, the ClearView db’s external enclosure which includes a touch screen interface is removed. This enables system integrator’s to have a compact and low cost gold box analyzer to incorporate into their design. A direct digital MODBUS interface allows for bidirectional communication with the OEM ClearView db and other peripherals. As shown in the image below, the OEM ClearView db gold box is approximately 9 inches long, 4 inches tall, and 5 inches wide.

The small form factor of the OEM gold box allows for simple integration.

Implementing a complete OEM Analyzer System

A complete OEM analyzer system includes OEM Clearview db, a sample interface such as an insertion probe or flow cell, and a pair of thermally stable fiber optical cables (link to thermal test report). Often the gold box is located out of the way, in a control room or internal electronics area. The fiber optical cables allows system integrators to then route a connection to the sample interface.

Depending on the application an appropriate flow cell or insertion probe design is selected. For example:

  • In the semiconductor industry, hydrofluoric applications require a flow cell constructed out of PFA/PEEK. The metal free flow cell construction is selected to prevent contamination or corrosion in the cleanroom environment. 
  • For medical device sterilization, a 50 cm vapor probe is selected for monitoring NO2, H2O2, O3, or other sterilants. The GSST probe was specifically designed to be invariant to pressure or other index of refraction changes that often occur during the vacuum sterilization cycle.

Ultimately by implementing the OEM ClearView db photometer with MODBUS and an appropriate ample interface, critical process monitoring information can be quickly delivered to process engineers and other end-users. Allowing your customers to make informed decisions in real-time.

Interested in learning more about the OEM process for the ClearView db?

QUESTIONS? WE’RE HERE TO HELP.

contact us

Continue reading

Improve Operational Safety through Phosgene Leak Detection

Improve Operational Safety through Phosgene Leak Detection

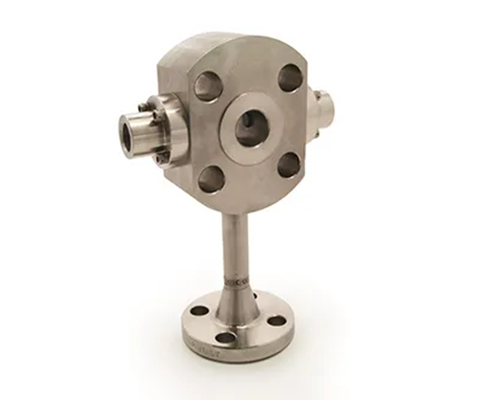
When processes involve extremely toxic or hazardous materials such as hydrofluoric acid, phosgene, isocyanates, etc., safety is paramount. Having a sample interface with built-in leak detection can help save human lives. Consequently, it is recommended that a High Safety Flow Cell be used when monitoring these situations. Constructed out of stainless steel or Hastelloy C276 with Kalrez seals, this flow cell is rated for 250 ºC typical operation at 300 psi. The safety sniffer port provided between o-ring seals allows for a connection to a leak detection system to be used as an indicator of primary seal failure.

For example, plant safety can be improved by monitoring the purity or concentration of phosgene using Guided Wave’s High Safety Flow Cell which is compatible with all Guided Wave analyzers and many other analyzer brands. Built into a Class 300 flange, using welded construction, the High Safety Flow Cell uses double o-ring sealed sapphire windows and a weep or “tattletale” port to self-monitor for o-ring failure. This safety mechanism allows the flow cell to be serviced once the process chemicals are detected in the space between the first and second o-ring seals. Moreover, by installing a High Safety Flow Cell on the input side of the reactor vessel and the recovery line, deviations in the amount of phosgene consumed by the process can be monitored, potentially alerting personnel to a hazardous leak in the facility. Thanks to the dual seals and a sniffer port, polymer manufacturers dealing with hazardous or corrosive samples, such as phosgene, can improve operational safety with the High Safety Flow Cell.

This is also compatible with all makes and models of process FT-NIR analyzers.

QUESTIONS? WE’RE HERE TO HELP.

contact us

Continue reading

How to Choose Pathlength: for APHA Color

How to Choose Pathlength: for APHA Color

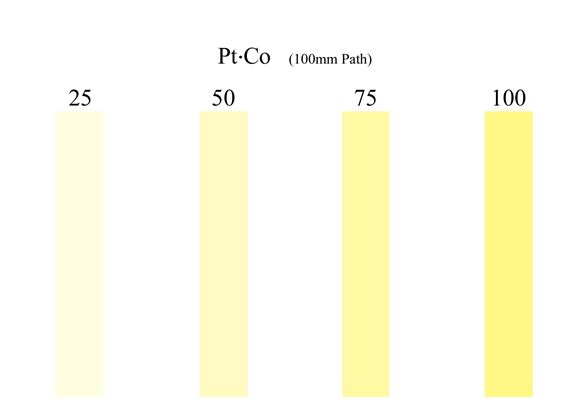
The APHA/Platinum-Cobalt color scale is described in ASTM D1209. The ASTM method is an off-line manual laboratory method. The original test design required an observer to compare the color of a product to a known standard, and then judge the “color”. This color scale ranges from 0 to 500. The lowest value of 0 is referred to as water white. A value of 500 is distinctly yellow. (Below illustrates the contrast from 0- 100 range.)

Two Different Pathlengths are Recommended for APHA Applications

If the user needs to measure the whole range, then we recommend a 30 mm pathlength for either an SST Insertion Probe or MultiPurpose Flow Cell. This allows for long enough pathlength to measure the lightly colored samples and but short enough to still collect light for the dark samples. Conversely if the customer is interested in measuring the lightly color samples with scores less than 300 units, we recommend the 50 mm pathlength. The longer pathlength allows better precision for distinguishing between lightly colored samples.

Still Need Help Selecting a Pathlength?

Guided Wave selects a pathlength for the sample interface that provides the best solution from a technical and economic standpoint. Finding the balance between the signal-to-noise of the measurement and cost to manufacture, as well as accessibility for cleaning/maintenance by the user is always Guided Wave’s priority.  For more information contact us.

QUESTIONS? WE’RE HERE TO HELP.

contact us

Continue reading

Karl H Norris – First Fellow of Near Infrared Spectroscopy (May 23, 1921-July 17, 2019)

Karl H Norris – First Fellow of Near Infrared Spectroscopy (May 23, 1921-July 17, 2019)

Sent: 2019-07-18 7:36:38 AM

EMAIL FROM Rick (C. Richard) DeVore (son-in-law to Karl H. Norris) with added links. Subject: Karl H. Norris news.

Dear Colleagues and Friends of Karl Norris,

It is with a heavy heart that I notify you of the passing of Karl Norris yesterday afternoon, 2019 July 17, in Alexandria VA.  Karl had entered the hospital on July 11 with two rapidly developing, antibiotic-resistant infections.  He fought valiantly but ultimately succumbed to them after transitioning to hospice care. His final hours were calm and pain-free, and he slipped away quietly at the end with family at his side.  He was 98 years old.

Karl is survived by one daughter and one son, two grandsons, three great-grandsons, one brother and one sister, and numerous nieces and nephews.  (I am his son-in-law.)  He was predeceased by his wife of 69 years, Maxine E. (Thomas) Norris, on 2017 August 28, and by his parents, two brothers, and two sisters.

Two weeks prior to his death, Karl was pursuing his normal everyday life in an assisted-living community.  He was ambulatory with a walker and needed help only with accurate administration of a very few daily medications.  His health was amazingly robust for his age.

Karl felt blessed by his continuing communications with many of you – by mail, by phone, in person – who shared his great joy in discovery and invention.  That ongoing contact was a source of satisfaction and delight for him in both the prime years and the sunset of his life.  We, his family, thank all of you for your varied associations with Karl over his long life.

Per his wishes, there will be no funeral, and Karl’s body will be cremated.  He and Maxine were long-time members of Emmanuel United Methodist Church in Beltsville MD, and a memorial service will be held there in the near future, date to be determined.

Owing to his stature in his profession, and the regard with which he was held by you and so many other colleagues, we are developing plans for a more formal celebration of his life and achievements at a facility and on a date to be determined.  We will keep all of you informed by email of the plans.  Please do let us know at your convenience if you intend to participate and of any constraints on scheduling that may affect you.  We would like to accommodate as many of his professional colleagues and friends as we possibly can.  Because Karl’s favorite gatherings were the IDRC meetings in Charmbersburg PA – he still regularly wore the colorful polo shirts from those conferences! – a service held before or after the 2020 assembly is a possibility, although that event is a year away.

The distribution of this message is not meant to be exclusive; please feel free to forward it to colleagues and friends whom you know but we have not yet managed to identify and acquire contact information.

Finally, please know that although we are saddened by this loss, and we are sure that many of you will be, Karl lived a long, eventful, fruitful life.  He did amazing things, visited amazing places, and worked with amazing people, such as yourselves. Celebrate and remember fondly your experiences with him, as he did his experiences with you, with a smile, even today.

With sincere thanks and regards,
Rick (C. Richard) DeVore

The Karl Norris Award

The Karl Norris Award honors the unique contribution of Karl Norris as the internationally recognized founder of near infrared spectroscopy in the modern world.

QUESTIONS? WE’RE HERE TO HELP.

contact us

Continue reading

Writing Custom Python Scripts in OmniView Part I

Writing Custom Python Scripts in OmniView Part I

Recently our support team wrote up a helpful tip on indexing the array of absorbance spectrum to get the desired wavelength in a custom python script which is executed by OmniView Software. For information on overwriting negative answers see Writing Custom Python Scripts in OmniView part II.

As shown in the image below, each channel on the spectrometer can be individually configured with a starting and stopping wavelength. Additionally, the step size can be adjusted.

If we assume that the starting wavelength will be 1000 nm and the ending wavelength will be 2100 nm with a 1 nm step size, then we could hard code in values.

For example, if we want to get the absorbance value at 1430nm then we could simply call

au = getAu(scan)
absorbance1430 = au[1430]
absorbance1450 = au[1450]
answer = aborbance1430 / absorbance1450

However, this will only work as long as the channel’s configuration does not change. If in the future someone adjusts the starting position or the step size then the position inside of the array will change and the above code will not work. To properly determine the index at which to find absorbance at a particular wavelength, e.g. 1430nm, the above code would have to calculate the index as follows:

au = getAu(scan)
wl = getWL(scan)
step = wl[1] - wl[0]
index1430 = float(1430 - wl[0])/step
absorbance1430 = au[index1430]

(And this code would need to be repeated for the absorbance at 1450.)

A simpler alternative is to use the getAuAt function which achieves the same thing as the above code in a single line:

answer = getAuAt(scan, 1430) / getAuAt(scan, 1450)

Interested in learning more? Check out the training videos we have on our youtube channel.

Questions? We’re here to help.

Contact Us

Continue reading

How does the Flow Rate, Viscosity, and Pipe Diameter, Effect Accurate (good) NIR Measurements?

How does the Flow Rate, Viscosity, and Pipe Diameter, Effect Accurate (good) NIR Measurements?

Customers are often concerned with what flowrates are compatible with our Multipurpose flow cells and sample systems. To help answer this question Guided Wave has developed a Reynolds Number calculator, which is located towards the bottom of this webpage. The same concerns can also be applied to our family of insertion transmission spectroscopy probes, but we will limit our discussion to the less complex geometry of the flowcell.

The Relationship Between Analyzer Noise and Reynolds Number

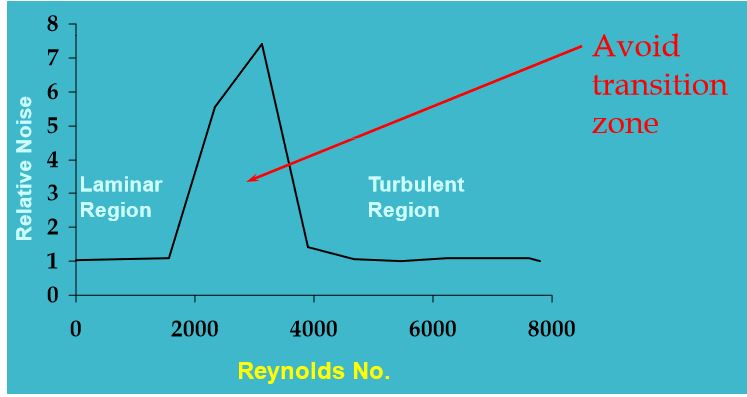
The question of flow rate cannot be answered without more information regarding the sample. To achieve stable Near Infrared Spectroscopy readings, a steady flow of fluid must be passing through the optical beam during the measurement. The flow can either be smooth and laminar or turbulent. Flowrate alone cannot be determined without understanding the fluid dynamics such as the kinematic viscosity and the diameter of the pipe passing through the flowcell. Additionally, if the flow has particulates, bubbles, or mixed phases which will vary the chemical composition and index of refraction during the measurement period, then the NIR measurement will not be stable.

What is Viscosity?

The textbook definition of viscosity is the resistance of the fluid to flow or deform. Said another way, viscosity is the thickness of the fluid. The classic example is molasses which is thicker and thus has a higher viscosity than water. This may be referred to as the absolute or dynamic viscosity of the liquid.

What is Kinematic Viscosity?

The kinematic viscosity of a fluid is the ratio of the viscosity of the fluid to the fluid’s density. For most fuel and other liquids, fluid dynamic values have already been tabulated. For example, 100% ethanol at 25C has the following known properties.

What is a Reynolds Number?

The Reynold Number (Re) is a mathematical equation helps to determine if the flow in the pipe is Laminar Flow or Turbulent Flow. This is achieved by relating the kinematic viscosity of the fluid, diameter of the pipe, and the linear speed or flowrate of the liquid sample. See equation 1

*To achieve laminar flow Re < 2100 or turbulent flow Re> 3000

Relating the Flow Rate to the Fluid Velocity.

To calculate the linear velocity of the fluid we use equation 2, shown below. Our 10 mm pathlength Multipurpose Flowcell has an approximate internal surface area of 9.37×10⁻⁵ m2.

Calculating the Reynolds Number for Ethanol.

If we assume the flow rate through the inner 0.43-inch pipe diameter (1/2 inch OD pipe) is 3.0 L/min, then we get:

Fluid Velocity = (4*3(L/min)) / (3.14*(0.010922m)) = 0.53 meters per second

Now applying this value into equation 1 with the tabulated value for viscosity we see that:

Re= 0.53 m/s * 0.010922m / 0.000001 m2/s ≈ 4500

Because a Re of 4500 is greater than 3000, we can be confident that the flow through the optical beam of the flowcell is turbulent. Thus measurement of the sample liquid should result in high-quality spectra. This again assumes that the liquid sample passing through the flowcell is heterogeneous and free of particulate matter or other contaminants.

Interested in determining what your Renolds number is? Check out the Reynolds number calculator below.

The Next Step

The next step in solving your process monitoring challenges is to complete our Application Questionnaire. With information such as the concentration range, sample temperature and viscosity Guided Wave engineers and sales representatives can design you a fit for purpose solution. Guided Wave manufactures a wide variety of rugged fiber optic process probes offering high optical efficiency, durability, reliability, convenience, accurate pathlengths, and value. Contact a sales representative for help solving your process challenges.

QUESTIONS? WE’RE HERE TO HELP.

contact us

Continue reading

Too Much Benzene Tanking Your Profits?

Too Much Benzene Tanking Your Profits?

Gas pump in gas tank

Questions? We’re here to help.

Contact Us

Continue reading